Date: 8 Nov, 2024
Fundamental Analysis, DCF Model and article written by Rishabh Jain
Fundamental Analysis:
Size of Company :
- Total Market Cap of company is around 94 Thousand Crores. Which is relatively small for a Bank, which means there is significant room for grwoth in future.
- Total deposits of the Bank are around 13 Lakh Crores as of March, 2024, up from 6.25 Lakh Crores in 2020. 13 Lakh Crores deposits is around 6.5% of total Bank deposits in overall Bank industry. So the Bank holds significant holdings and market share of total deposits.
- Gross NPA or Non- performing asset of the Bank stands at around 4.23%, while net NPA at 1.27% as of March, 2024.
Margins :
- Cost of funds for the Bank is around 5%. Which is very low and provides ample room for higher interest margins.
- Current Interest Margin is around 3.05%, which is decent, but we can still expect this margin to grow more and make Bank even more profitable.
Valuation :
- P/E Ratio of the company is around 5.8 which is low compared to industry average of 12.
- Dividend yield is around 3.2%, while company earned EPS 17 recent year, it paid dividend of around 3.22 Rupees per share.
- Book value per share, is around 103 rupee per share, so PB is around 1.01, which makes it undervalued overall.
- Graham Number for this stock is 201 rupees per share, which makes it undervalued at current market price of 104 per share.
- NCAVPS (Net current asset value per share) is around 126 rupees per share, making this stock trading below its liquidation value.
- ROE (Return on Equity) last Fiscal year was around 17.9% per annum, while ROE last 5 year average was 10.5% per annum.
Discounted Cash-flow Model Summary :
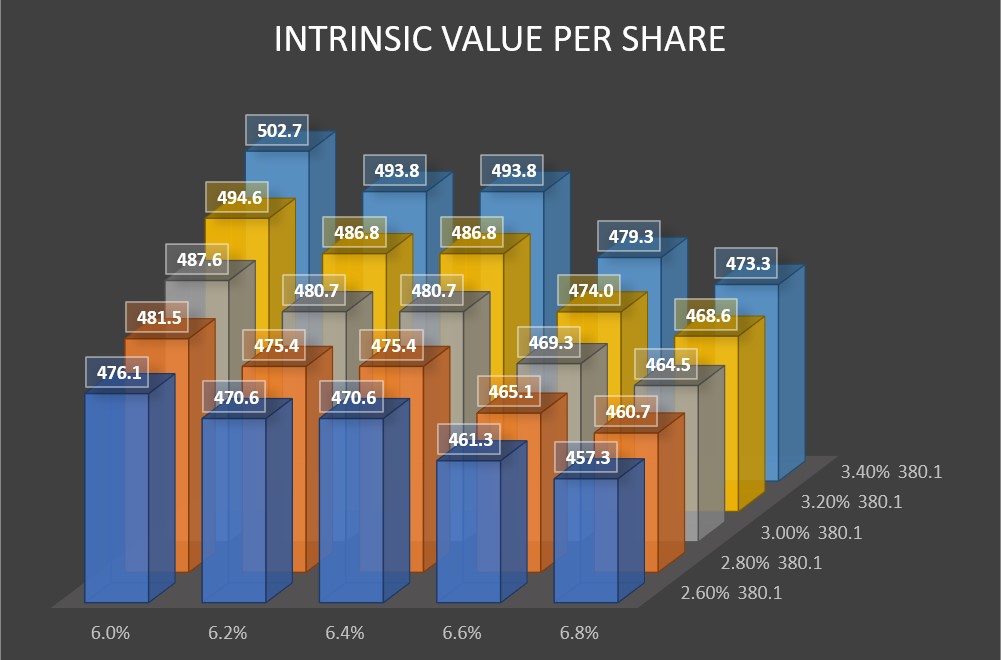
- Weighted average cost of capital WACC, came out to be around 6.4%, which is quite decent.
- Range of Intrinsic value per share of Canara Bank came out to be around 450-500 rupees per share, in base case scenario. This valuation model relied more heavily on Terminal value (87%), and only 13% on cash-flows in next 5 years.
- For further details, download and go through DCF Model (Excel file) below.
DCF Model:
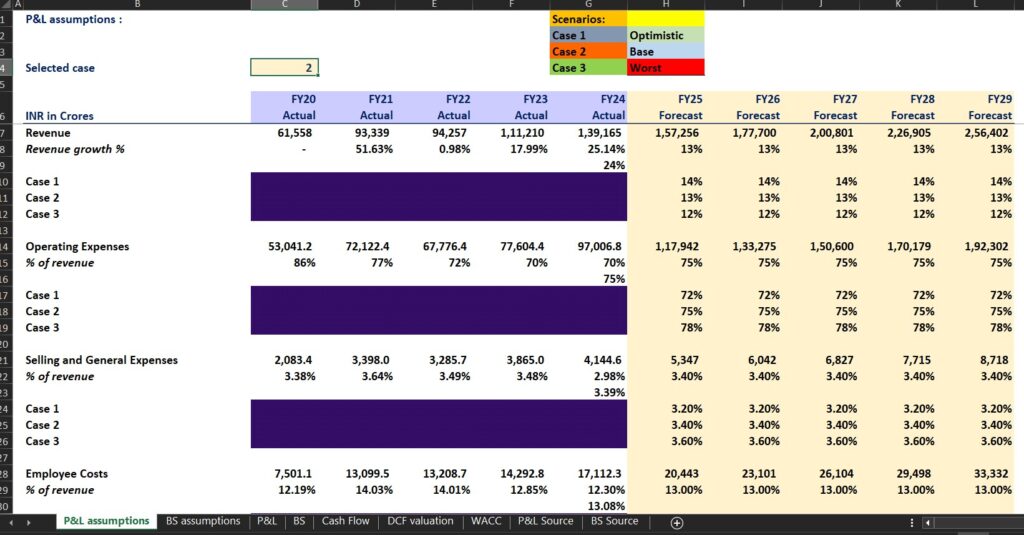
Cases and Assumptions :
| Cases | 1 | 2 | 3 |
| Revenue Growth% | 14.0 | 13.0 | 12.0 |
| Operating Expesnes % Revenue | 72.0 | 75.0 | 78.0 |
| Employee expenses % revenue | 12.5 | 13.0 | 13.5 |
| Current Liability growth% | 14 | 14 | 14 |
| Terminal value growth% | 3 | 3 | 3 |
DCF Model Excel File:
Disclaimer:
This DCF Model is for Educational and Research purposes ONLY. The DCF model was based on several Assumptions, and it doesn’t Guarentee it will happen in future. This is not in any form a Financial Advice. Do your own Due-Diligence for Investing.
For more details visit our Legal Page –https://r1hedge.com/legal/